15 April 2010
Lab 3: Neogeography
View California Architectural Sights in a larger map
As a civil engineering major, I take great interest in architectural structures. California is home to many. I created a mashup that maps several of the major architectural structures in this state, creating a tool that architecture enthusiasts, like I, can use to further expand on our interests. The map includes a variety of bridges, buildings, and other structures. The icons each include a short description of the sight, as well as a photo or a short video.
By combining different elements and forms of media with geographic material, this map demonstrates the very essence of neogeography. Neogeography, meaning "new geography," involves the sharing of geographic data and the interaction that mashups enable. People use and compile their own maps, creating a geography that is centered on the user. This wide-scale interaction forms larger communities in which the possibility of generating many new ideas increases. Because it is easy to use, professionals and amateurs alike can share their maps, and geography becomes easier to teach. In addition, neogeography allows individuals to give perspective to raw geographic data.
However, despite its many advantages, neogeography has pitfalls as well. The convenience of producing maps causes the credibility of all information to be questionable. It becomes incredible easy and common for incorrect or unreliable information to be relayed. The internet also permits access to all information. Many have argued that tools such as Google Maps and other geographic programs cause an invasion of privacy because cameras or satellite images have the potential of recording peoples' lives. To this day, the invasive nature of the developing technology of neogeography still remains a delicate issue. Nevertheless, neogeography is largely responsible for spreading the practice of geography, developing an innovative and interactive method to approaching spatial data.
14 April 2010
Lab 2: Topography
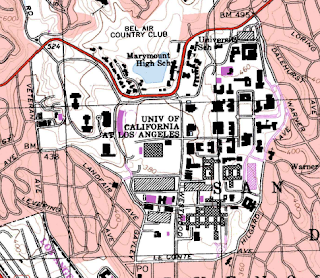
1. The name of the quadrangle is Beverly Hills.
2. The names of adjacent quadrangle are Canoga Park, Van Nuys, Burbank, Topanga, Hollywood, Venice, and Inglewood.
3. The first quadrangle was first created in 1966.
4. The North American Datum of 1927 (horizontal) and the North American Datum of 1983 (vertical) were used to create this map.
5. The scale of this map was 1:24000.
6. Scale conversions:
a) 5 centimeters on the map is approximately equivalent to 1200 meters on the ground.
b) 5 inches on the map is approximately equivalent to 1.89 miles on the ground.
c) 1 mile on the ground is approximately equivalent to 2.64 inches on the map.
d) 3 kilometers on the ground is approximately equivalent to 12.50 centimeters on the map.
7. The contour interval on the map is 20 feet.
8. The approximate geographic coordinates for:
a) the Public Affairs Building is N 34˚04'30", W 118˚26'10" or (34.08˚, -118.44˚)
b) the tip of the Santa Monica Pier is N 34˚00'25", W 118˚30'0" or (34.01˚, -118.50˚)
c) the Upper Franklin Canyon Reservoir is N 34˚07'25", W 118˚24'28" or (34.12˚, 118.41˚)
9. The approximate elevation of:
a) the Greystone Mansion is about 560 feet or 170.69 meters
b) the Woodland Cemetery is about 145 feet or 44.20 meters
c) the Crestwood Hills Park is about 1050 feet or 320.04 meters
10. The UTM zone of the map is zone 11.
11. The UTM coordinates for the lower left corner of the map are 3763000m N, 372000m E.
12. There are 1000000 square meters contained within each square of the UTM grid lines.
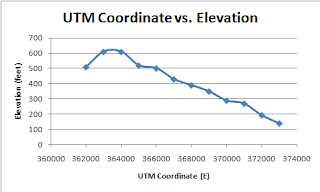
13. Elevation Profile from West to East.
14. The magnetic declination is 14.8 degrees east.
15. Water flows north in the intermittent stream between the 405 freeway and Stone Canyon.
16. UCLA

2. The names of adjacent quadrangle are Canoga Park, Van Nuys, Burbank, Topanga, Hollywood, Venice, and Inglewood.
3. The first quadrangle was first created in 1966.
4. The North American Datum of 1927 (horizontal) and the North American Datum of 1983 (vertical) were used to create this map.
5. The scale of this map was 1:24000.
6. Scale conversions:
a) 5 centimeters on the map is approximately equivalent to 1200 meters on the ground.
b) 5 inches on the map is approximately equivalent to 1.89 miles on the ground.
c) 1 mile on the ground is approximately equivalent to 2.64 inches on the map.
d) 3 kilometers on the ground is approximately equivalent to 12.50 centimeters on the map.
7. The contour interval on the map is 20 feet.
8. The approximate geographic coordinates for:
a) the Public Affairs Building is N 34˚04'30", W 118˚26'10" or (34.08˚, -118.44˚)
b) the tip of the Santa Monica Pier is N 34˚00'25", W 118˚30'0" or (34.01˚, -118.50˚)
c) the Upper Franklin Canyon Reservoir is N 34˚07'25", W 118˚24'28" or (34.12˚, 118.41˚)
9. The approximate elevation of:
a) the Greystone Mansion is about 560 feet or 170.69 meters
b) the Woodland Cemetery is about 145 feet or 44.20 meters
c) the Crestwood Hills Park is about 1050 feet or 320.04 meters
10. The UTM zone of the map is zone 11.
11. The UTM coordinates for the lower left corner of the map are 3763000m N, 372000m E.
12. There are 1000000 square meters contained within each square of the UTM grid lines.
13. Elevation Profile from West to East.

| UTM coordinate | Elevation |
| 362000 E | 510 |
| 363000 E | 610 |
| 364000 E | 610 |
| 365000 E | 520 |
| 366000 E | 502 |
| 367000 E | 430 |
| 368000 E | 390 |
| 369000 E | 350 |
| 370000 E | 290 |
| 371000 E | 270 |
| 372000 E | 194 |
| 373000 E | 140 |
14. The magnetic declination is 14.8 degrees east.
15. Water flows north in the intermittent stream between the 405 freeway and Stone Canyon.
16. UCLA

Subscribe to:
Comments (Atom)