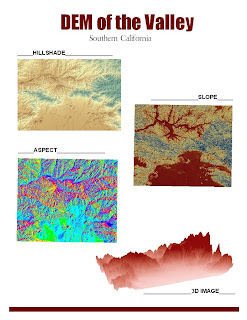
The maps above are the Digital Elevation Models, or DEMs, for an area of land in the northern part of the Los Angeles County. I chose this area because I grew up in the San Fernando Valley. Mountains are visible from my house, and these varying elevation levels make this part of the land ideal for DEMs. The topography of the area is portrayed on the map as ragged peaks in the northern half of the map and flat terrain (of the city) that lies below. The hillshade map shows a shaded relief model of my area, with the blue color signifying higher elevation. The slope map shows the degree of steepness in my map and the aspect map shows the direction that the area faces. To make the slope and aspect maps, I needed to convert the z-coordinate (the height) from meters to decimal degrees so that it would correspond to the the decimal degree measurements of the area of the map. The extent of my area is as follows:
top: 34.502°
left: -118.716°
right: -118.265°
bottom: 34.192°
The location lies within the UTM zone 11 and the spatial reference that I used was the GCS North American 1983.
I love the design work that you are putting into your projects. Keep it up. Just a note on the hillshade and slope coloring scheme: because it's a gradient (from low to high) you should keep the color scheme going from a low value to a high value and not from one color to another and then back.
ReplyDelete